这篇文章主要为大家详细介绍了C#Chart绘制简单图形波形,文中示例代码介绍的非常详细,具有一定的参考价值,感兴趣的小伙伴们可以参考一下
本文实例为大家分享了C# Chart绘制简单图形波形的具体代码,供大家参考,具体内容如下
此次用C#绘制波形使用的是Chart控件
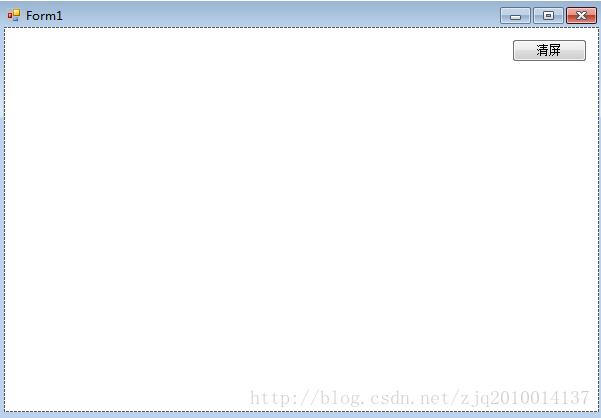
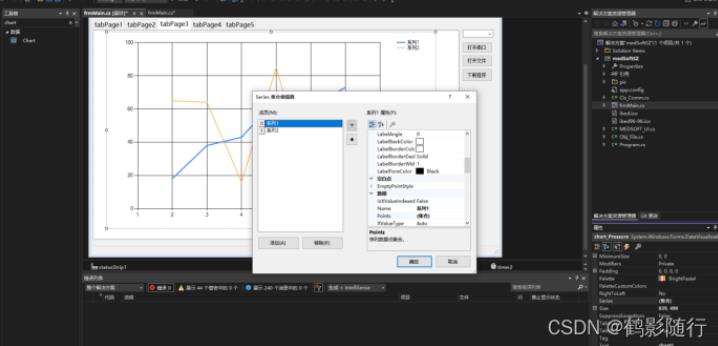
1、将Chart控件拖进主界面,然后设置属性。
//
// chart1
//
chartArea2.Name = "ChartArea1";
this.chart1.ChartAreas.Add(chartArea2);
legend2.Name = "Legend1";
this.chart1.Legends.Add(legend2);
this.chart1.Location = new System.Drawing.Point(36, 6);
this.chart1.Name = "chart1";
series3.BorderWidth = 3;
series3.ChartArea = "ChartArea1";
series3.ChartType = System.Windows.Forms.DataVisualization.Charting.SeriesChartType.Line;
series3.Legend = "Legend1";
series3.Name = "系列1";
series4.BorderWidth = 2;
series4.ChartArea = "ChartArea1";
series4.ChartType = System.Windows.Forms.DataVisualization.Charting.SeriesChartType.Line;
series4.Legend = "Legend1";
series4.Name = "系列2";
this.chart1.Series.Add(series3);
this.chart1.Series.Add(series4);
this.chart1.Size = new System.Drawing.Size(839, 499);
this.chart1.TabIndex = 0;
this.chart1.Text = "chart1";
2、画线委托函数
public delegate void ChartDelegate(int series, double Value_Y_Axis); // 声明委托
public void DrawPoint(int series, double Value_Y_Axis)
{
    try
    {
        if (this.chart1.InvokeRequired)
        {
            this.chart1.Invoke((ChartDelegate)DrawPoint, series, Value_Y_Axis);
        }
        else
        {
            this.chart1.Series[series - 1].Points.Add(Value_Y_Axis);
        }
    }
    catch
    {
        MessageBox.Show("ERROR!");
    }
    //chart1.Series[series - 1].Points.Add(Value_Y_Axis);
}
3、设置一个按键,然后设置按键点击触发时候的定时器Timer属性,用来触发波形产生(用控件按键触发)
private void button3_Click(object sender, EventArgs e)
{
    System.Timers.Timer timer11 = new System.Timers.Timer(400); // 每400ms触发一次
    timer11.Elapsed += new System.Timers.ElapsedEventHandler(timer_handle); // 执行函数tiemr_handle
    timer11.AutoReset = true;
    timer11.Enabled = true;
    timer11.Start();
}
4、定时器触发执行函数
public int gIndex = 1;
public void timer_handle(object source, System.Timers.ElapsedEventArgs e)
{
    double mpre1 = Log10(gIndex) * 300;
    double mpre2 = Sin(gIndex) * 200;
    //
    DrawPoint(1, mpre1);
    DrawPoint(2, mpre2);

    gIndex++;
}
效果动态图:
以上就是本文的全部内容,希望对大家的学习有所帮助,也希望大家多多支持得得之家。
沃梦达教程
本文标题为:C# Chart绘制简单图形波形


基础教程推荐
猜你喜欢
- Unity虚拟摇杆的实现方法 2023-02-16
- C#中参数的传递方式详解 2023-06-27
- C#实现归并排序 2023-05-31
- C#使用NPOI将excel导入到list的方法 2023-05-22
- C#使用SQL DataAdapter数据适配代码实例 2023-01-06
- 浅谈C# 构造方法(函数) 2023-03-03
- C#执行EXE文件与输出消息的提取操作 2023-04-14
- 如何用C#创建用户自定义异常浅析 2023-04-21
- C# TreeView从数据库绑定数据的示例 2023-04-09
- C#使用Chart绘制曲线 2023-05-22


