这篇文章主要为大家详细介绍了C#根据excel数据绘制坐标图的方法,文中示例代码介绍的非常详细,具有一定的参考价值,感兴趣的小伙伴们可以参考一下
本文实例为大家分享了C#根据excel数据绘制坐标图的具体代码,供大家参考,具体内容如下
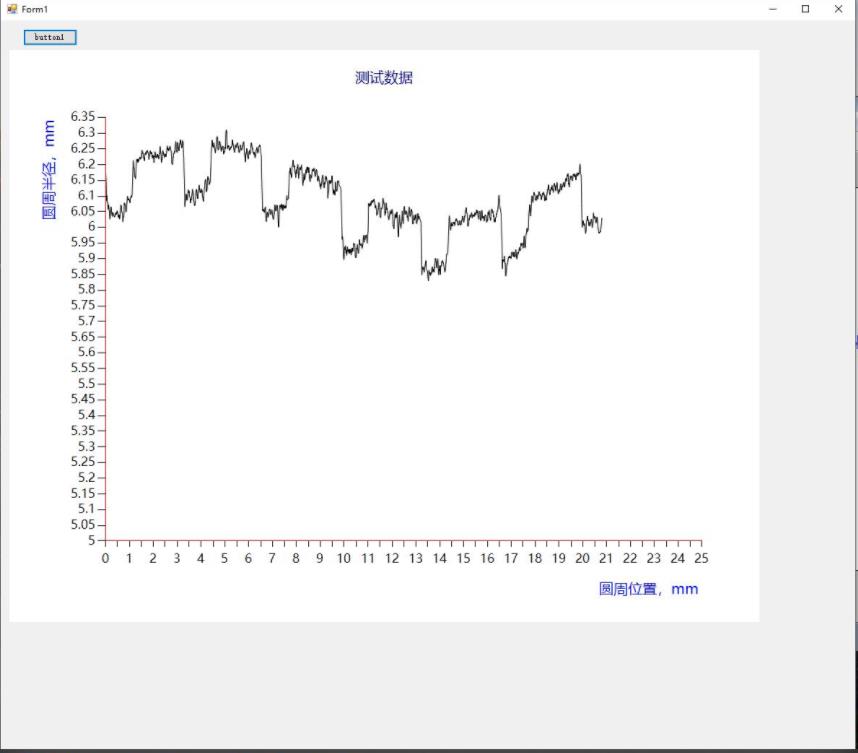
效果如下图

界面

代码
using System;
using System.Collections;
using System.Collections.Generic;
using System.Drawing;
using System.Runtime.InteropServices;
using System.Windows.Forms;
using System.Windows.Forms.DataVisualization.Charting;

namespace WindowsFormsApp2
{
    public partial class Form1 : Form
    {
        //x和y轴数据
        double[] x = new double[] { 0, 0, 0, 0, 0, 0, 0, 0, 0, 0 };
        double[] y = new double[] { 0, 0, 0, 0, 0, 0, 0, 0, 0, 0 };
        List<Double> xList = new List<Double>();
        List<Double> yList = new List<Double>();
        public Form1()
        {
            InitializeComponent();
        }

        private void button1_Click(object sender, EventArgs e)
        {
            string fname = "";
            OpenFileDialog fdlg = new OpenFileDialog();
            fdlg.Title = "Excel File Dialog";
            fdlg.InitialDirectory = @"c:\";
            fdlg.Filter = "All files (*.*)|*.*|All files (*.*)|*.*";
            fdlg.FilterIndex = 2;
            fdlg.RestoreDirectory = true;
            if (fdlg.ShowDialog() == DialogResult.OK)
            {
                fname = fdlg.FileName;
            }


            Microsoft.Office.Interop.Excel.Application xlApp = new Microsoft.Office.Interop.Excel.Application();
            Microsoft.Office.Interop.Excel.Workbook xlWorkbook = xlApp.Workbooks.Open(fname);
            Microsoft.Office.Interop.Excel._Worksheet xlWorksheet = xlWorkbook.Sheets[1];
            Microsoft.Office.Interop.Excel.Range xlRange = xlWorksheet.UsedRange;

            int rowCount = xlRange.Rows.Count;
            int colCount = xlRange.Columns.Count;

            for (int i = 1; i <= rowCount; i++)
            {
                double px = System.Convert.ToDouble(xlRange.Cells[i, 1].Value2.ToString());
                double py = System.Convert.ToDouble(xlRange.Cells[i, 2].Value2.ToString());
                Console.Out.WriteLine("第" + i + "行 :" + px + "," + py);
                xList.Add(px);
                yList.Add(py);
                //for (int j = 1; j <= colCount; j++)
                //{
                //write the value to the Grid
                //if (xlRange.Cells[i, j] != null && xlRange.Cells[i, j].Value2 != null)
                //{
                //xList.Add(xlRange.Cells[i, j]);

                // Console.WriteLine(xlRange.Cells[i, j].Value2.ToString());
                //add useful things here!
                // }
                /
沃梦达教程
本文标题为:C#根据excel数据绘制坐标图的方法


基础教程推荐
猜你喜欢
- 如何用C#创建用户自定义异常浅析 2023-04-21
- C#中参数的传递方式详解 2023-06-27
- 浅谈C# 构造方法(函数) 2023-03-03
- Unity虚拟摇杆的实现方法 2023-02-16
- C# TreeView从数据库绑定数据的示例 2023-04-09
- C#使用SQL DataAdapter数据适配代码实例 2023-01-06
- C#使用NPOI将excel导入到list的方法 2023-05-22
- C#实现归并排序 2023-05-31
- C#执行EXE文件与输出消息的提取操作 2023-04-14
- C#使用Chart绘制曲线 2023-05-22


